


5 Biases that Stop You from Mastering TFT Stats Analysis


Set 9.5 was just released a week ago, and with it came the much awaited return of augments related stats. So now more than ever, it is crucial to learn this often overlooked skill: Properly reading TFT stats and avoid falling into statistical biases pitfalls. Let’s get started.
What is statistical bias anyway?
Before we get started with examples, let’s look at how Wikipedia defines statistical bias: “Statistical bias is a systematic tendency in which the methods used to gather data and generate statistics present an inaccurate, skewed or biased depiction of reality”.
In practice, this basically means that whenever you are presented with statistics about TFT, you must be very careful with the conclusions you draw from it. That is because the data you are basing your interpretation on will never be a perfect representation of the game.
In this article we will look into 5 biases that you have to be wary about when reading TFT stats. By understanding them, you will be able to overcome the pitfalls they represent and in turn, become a Challenger in TFT stats analysis!
But first a quick disclaimer: This article is gonna make some gross oversimplifications for the sake of simplicity and pedagogy. So I kindly ask that you restrain from drawing definite conclusions on the current meta from the examples used below. The point of this article is not to give meta advice on the current patch but just to illustrate example of biases. Many thanks!
Now, let’s get into the examples:
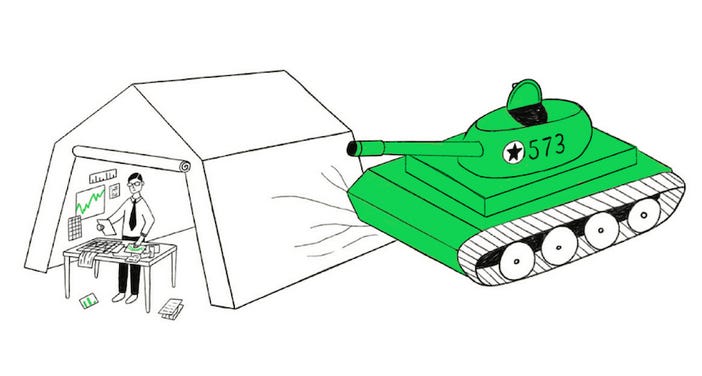
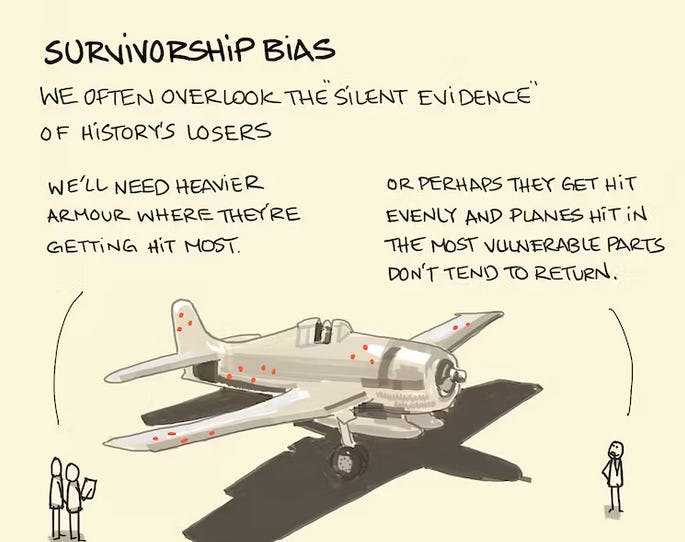
1 — Survivorship bias
The definition of Survivorship bias is the following: “ Survivorship bias is the logical error of concentrating on entities that passed a selection process while overlooking those that did not. This can lead to incorrect conclusions because of incomplete data ”.
TFT is very much subject to Survivorship bias since we only have access to data on the state of the game in it’s last round. The best examples of this, are Legendary units (5 cost). Let’s look at Ahri and Silco’s stats:


Upon seeing those, your first reaction might be: “Wow, Ahri is performing much better than Silco on all metrics, she must a superior unit by far! ”. But of course, the truth is not that simple: Ahri’s impressive average placement of 3.75 and her win-rate of 18.1% come with a twist.
Indeed, for a player to have the opportunity to buy an Ahri in his shop, he most likely already reached the late game with a few players eliminated. Thus, Arhi is mostly played by players who have already secured a good placement even before playing her — the “Survivors” of the lobby! Because of this, it would be disingenuous to completely attribute the merit of those great stats to Ahri’s power as a unit.
“But if all the data we have comes from post game infos, how can I avoid Survivorship bias ?” you may ask. Well, to fight this bias and many more, you always want to make sure you are not comparing apples to oranges. In TFT, this means comparing with each other units of same cost or Augments of the same tier etc.
This time, let’s look at the stats of all the 5 cost units (Ryze excluded for the sake of this article’s length):

Here we can see that out of those 7 legendary units, Ahri is the second worst performer and the worst carry. Even GP who can (arguably) use the same items than her has a better average placement.
Now let’s go back to Silco and also compare him to units of the same value:

Unlike Ahri, we can see that Silco actually averages pretty well in his category: 4th best overall and 3rd best carry out of 12 units.
Thus, it looks like Silco is actually performing better than Ahri, and her good looking stats are partially carried by the Survivorship bias.
2 — Omitted-variable bias
Omitted-variable bias happens when you draw conclusion from data about a system but are missing a key underlying variable of the said system. What happens then, is that you will attribute trends in data to the other variables and draw incorrect conclusions.
A good TFT related example is the relation between units and augments or traits, for example let’s look at Jayce (3 stars upgrade) stats:

Seems pretty good right? 3.06 of avg. is the best avg of all the 3 stars 3 cost of the roster, probably thanks to the recent buff you might say? Well let’s hold our horses and look at the stats for Jayce 3 stars when excluding Piltover of the sample:

As you can see, excluding Piltover drops the avg. of Jayce by 0.35, this means that a big portion of the success of of Jayce comps relies on the Piltover trait and probably on the power of the T-Hex as a unit.
If we omitted the trait variable of the equation we might have completely over-estimated the value of Jayce in himself and taken wrong decisions in game.
3 & 4— Confirmation and Publication bias
Next, let’s discuss simultaneously Confirmation and Publication biases since the way they impact interpretation in the context of TFT is very similar. Let’s compare definitions:
Confirmation bias is the tendency to search for, interpret, favor, and recall information in a way that confirms or supports one’s prior beliefs.
Publication bias is the tendency to search for, interpret, favor, and recall information in a way that support more significant/clear-cut findings.
As you see the way this two biases impact our interpretation is similar — we tend to only look at stats that either confirms our pre existing beliefs or that validate a significant finding worth sharing, writing about, making videos about etc.
For example, if you are convinced that Morello on Kai’Sa is BIS you will look at these stats and instantly find validation that you were right:


Indeed with a negative delta of -0.32 (meaning that Kai’Sa with Morello place on average 0.32 better than without) and an avg. placement of 4.06 it seems that Kai’Sa with Morello performs quite well. Even more impressive, Spear of Shojin pales in comparison with a meagre -0.14 delta and 4.29 avg. placement.
Let’s go a bit deeper in the analysis though, shall we? If we filter on one of the most common composition played around Kai’Sa and look at the items stats again, here is what we see:


In this setup, Morello Kai’Sa seems to perform way worse than overall (+0.21 compared to the previous delta). And bad news keep piling on for Morello’s believer because we see that Sunfire Cape on Nasus actually has a much better delta and avg. placement:

As you have already understood, by going deeper in the analysis we were able to draw the conclusion that Morello Kai’Sa is actually not ideal in it’s most played setup (but is probably quite good on a Kai’Sa that does not need to carry, in Void comps for example).

5 — Sampling bias
Our last bias is pretty straightforward but worth mentioning: Sampling bias. Basically, Sampling bias means that your stats are only representative of the sample you are basing your analysis on.
In the case of TFT the main example is Elo filtering: if you look at stats of comps, augments etc. without filtering by the Elo of the players you will skew your interpretation of a comp/augment real strength because most games in the sample were played in lobbies were the understanding of the game/meta is not optimal.
The Ravenous Hunter augment seems to be a pretty good example of this phenomenon in the current patch:


We can see a delta of +0.40 average placement between Master+ Elo and Gold+ Elo. This means that if you look at the overall stats of this augment on the entire player base you will over-estimate it’s value, because in higher level of play it is way harder to perform well with this augment for various reasons (tempo, max cap etc.). On the contrary this augment tends to perform well at lower Elo as it is pretty straightforward to play and leaves little room for mistakes.
In the previous example we identified that working with an excessively inclusive sample can lead to wrong interpretations of the meta at the top level. On the other hand, we also must be wary of too small sample size! A quick example:

Here we see that Tiny Power I has a 4.10 average placement in Master+ games but was only played 21 times: This is way too low a sample size to draw any conclusions from!
I am not gonna go into more details on the subject of sample size but I do have a dedicated article coming on on the topic. We will demonstrate what is the minimum sample size necessary to read significant trend in average placement of augments, comps etc… so stay tuned!
TLDR
There are multiple bias that can skew our analysis and understanding of TFT stats, but most of them can be managed by being aware of them and adapting our analysis accordingly!
Conclusion
So here it is: 5 Biases that can plague your TFT stats analysis. There is obviously much more to say on the subject, we only scratched the surface with a few examples. So if you liked this article make sure to give a like and asks your questions is the comment section ! If enough people are interested, I will definitely write a follow-up guide !
Anyway, I hope you enjoyed the read and I will see you guys in the Convergence!
Loved this article, would love to see one explaining how to do this data analysis and basic data analysis concepts